
| 일 | 월 | 화 | 수 | 목 | 금 | 토 |
|---|---|---|---|---|---|---|
| 1 | ||||||
| 2 | 3 | 4 | 5 | 6 | 7 | 8 |
| 9 | 10 | 11 | 12 | 13 | 14 | 15 |
| 16 | 17 | 18 | 19 | 20 | 21 | 22 |
| 23 | 24 | 25 | 26 | 27 | 28 | 29 |
| 30 | 31 |
- Ga
- 서평
- MySQL
- Blog
- 시각화
- 파이썬
- python visualization
- 매틀랩
- 통계학
- 리눅스
- 파이썬 시각화
- tensorflow
- matplotlib
- Python
- Tistory
- 텐서플로
- 한빛미디어
- 티스토리
- Linux
- 월간결산
- 딥러닝
- 서평단
- 독후감
- Google Analytics
- Pandas
- SQL
- Visualization
- MATLAB
- 한빛미디어서평단
- 블로그
- Today
- Total
목록파이썬 (184)
pbj0812의 코딩 일기
 [PYTHON] transform 을 사용한 데이터 변환
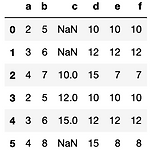
0. 목표 - transform 을 사용한 데이터 변환 1. 실습 1) library 호출 import pandas as pd 2) 데이터 프레임 생성 df = pd.DataFrame({'a' : [1, 2, 3, 1, 2, 3], 'b' : [4, 5, 6, 4, 5, 7]}) 3) 모든 데이터에 1 씩 더하기 df2 = df.transform(lambda x : x + 1) 4) 데이터 프레임 옆에 groupby 결과를 넣고 싶을 때 (1) groupby 만 사용해보기 - groupby 결과가 index 별 숫자이기에 딸려 들어간 형태 - a 로 그룹화할 때 b의 합은 2 : 10, 3 : 12, 4 : 15 이기에 인덱스 찾아감 df2['c'] = df2.groupby(by = ['a'])['b']..
 [PYTHON] pandas 로 UNION 구현하기
0. 목표 - pandas 로 UNION 구현하기 1. 실습 1) library 호출 import pandas as pd 2) 데이터 프레임 생성 a = pd.DataFrame({'a' : [1, 1, 2, 3, 4], 'b' : [1, 2, 3, 4, 5]}) b = pd.DataFrame({'a' : [1, 2, 3, 4, 5], 'b' : [1, 3, 5, 5, 9]}) 3) 데이터 프레임 결합 c = pd.concat([a, b]) 4) 중복 제거 - inplace 옵션을 통한 변수에 바로 저장 c.drop_duplicates(inplace = True) 5) index 초기화 - inplace 옵션을 통한 변수에 바로 저장 c.reset_index(drop = True, inplace = Tru..
 [PYTHON] displot, histplot 크기 조정하기
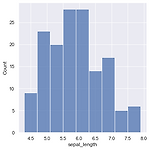
0. 목표 - displot, histplot 크기 조정하기 1. 실습 1) library 호출 - figure size 미리 조정 * seaborn version update 필요 : pip install seaborn==0.11.1 import matplotlib.pyplot as plt import seaborn as sns sns.set(rc={'figure.figsize':(15, 5)}) import pandas as pd 2) iris 데이터셋 로드 df = sns.load_dataset('iris') 3) distplot - 없어질거라고 한다. sns.distplot(df['sepal_length']) 4) histplot - 크기가 잘 맞춰 나온다. sns.histplot(df['sepa..
 [PYTHON] subplots 를 이용한 y축이 두 개인 그래프(plotyy) 그리기
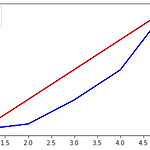
0. 목표 - subplots 를 이용한 y 축이 두 개인 그래프(plotyy) 그리기 1. 실습 1) matplotlib 으로 그리기 (1) library 호출 import matplotlib.pyplot as plt (2) 데이터 생성 x1 = [1, 2, 3, 4, 5] y1 = [1, 2, 3, 4, 5] x2 = [1, 2, 3, 4, 5] y2 = [1, 10, 50, 100, 200] (3) subplots 생성 fig, axe1 = plt.subplots() (4) ax 복사 axe2 = axe1.twinx() (5) 그래프 그리기 c1 = axe1.plot(x1, y1, color = 'r') c2 = axe2.plot(x2, y2, color = 'b') axe1.set_ylabel('..
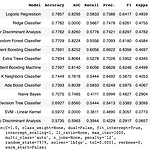 [Machine Learning] pycaret tutorial 따라하기
자세한 정보를 얻고 싶으시면 pycaret tutorial을 참조하시기 바랍니다. 0. 목표 - pycaret tutorial 따라하기 1. 실습 1) 설치 !pip install pycaret !pip install shap #interpret_model 사용시 필요 2) 데이터 불러오기 from pycaret.datasets import get_data diabetes = get_data('diabetes') 3) setup - 학습 데이터가 무엇인지, 목표 클래스는 무엇인지 설정 - 엔터 한번 입력해야 함 from pycaret.classification import * data = setup(diabetes, target = 'Class variable') 4) 모델 비교 - 예시에는 xgboos..
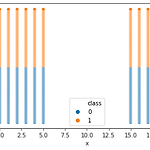 [Machine Learning] KMeans 를 통한 자동 편 가르기
0. 목표 - KMeans를 통한 자동 편 가르기 1. 실습 1) 데이터 생성 import numpy as np x = np.linspace(0, 5, 6) y = np.linspace(0, 100, 101) xx, yy = np.meshgrid(x, y) xxx = np.reshape(xx, (-1, )) yyy = np.reshape(yy, (-1, )) x2 = np.linspace(15, 20, 6) y2 = np.linspace(0, 100, 101) xx2, yy2 = np.meshgrid(x2, y2) xxx2 = np.reshape(xx2, (-1, )) yyy2 = np.reshape(yy2, (-1, )) import pandas as pd df = pd.DataFrame({'x' : ..
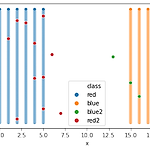 [Machine Learning] KNN 으로 편가르기
0. 목표 - KNN 으로 편가르기 1. 실습 1) 데이터 생성 - 두 팀 생성 import numpy as np x = np.linspace(0, 5, 6) y = np.linspace(0, 100, 101) xx, yy = np.meshgrid(x, y) xxx = np.reshape(xx, (-1, )) yyy = np.reshape(yy, (-1, )) x2 = np.linspace(15, 20, 6) y2 = np.linspace(0, 100, 101) xx2, yy2 = np.meshgrid(x2, y2) xxx2 = np.reshape(xx2, (-1, )) yyy2 = np.reshape(yy2, (-1, )) 2) 데이터 프레임화 import pandas as pd df = pd.Data..
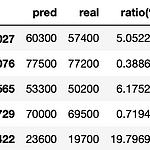 [Machine Learning] RandomForest 를 이용한 집값 예측
0. 목표 - RandomForest 를 이용한 집값 예측 1. 실습 1) 데이터 생성 - randomGenerator : 데이터 길이, 최소값, 최대값을 입력하면 주어진 길이만큼 최소값, 최대값 범위에서 랜덤한 정수로 채워줌 - root, yard, bathroom, livingroom, room 변수 생성 - price에는 각 변수에 원하는 값을 매겨서 합산(정확한 가중치 적용) import pandas as pd import random def randomGenerator(num_len, num_min, num_max): result = [] for i in range(num_len): result.append(random.randint(num_min, num_max)) return result r..
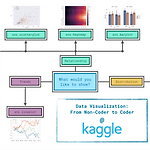 [kaggle] Data Visualization 수료과정
0. 목차 및 내용 1) Hello, Seaborn - notebook 설명, csv 읽기, lineplot plt.figure(figsize=(16,6)) sns.lineplot(data=fifa_data) 2) Line Charts - title, xlabel, label plt.figure(figsize=(14,6)) plt.title("Daily Global Streams of Popular Songs in 2017-2018") sns.lineplot(data=spotify_data['Shape of You'], label="Shape of You") sns.lineplot(data=spotify_data['Despacito'], label="Despacito") plt.xlabel("Date")..
 [kaggle] Python 수료과정
0. 목차 및 내용 1) Hello, Python - if, 문자열 곱하기 결과, 산술연산자 2) Functions and Getting Help - help() 함수, 함수 제작 방법, Default arguments - Docstrings def test(): """doc_string""" help(test) - 결과 Help on function test in module __main__: test() doc_string 3) Booleans and Conditionals - 비교연산자 4) Lists 5) Loops and List Comprehensions - for, while, list comprehensions 6) Strings and Dictionaries - str 만드는 법, 특수 ..