
Notice
Recent Posts
Recent Comments
Link
| 일 | 월 | 화 | 수 | 목 | 금 | 토 |
|---|---|---|---|---|---|---|
| 1 | 2 | 3 | 4 | |||
| 5 | 6 | 7 | 8 | 9 | 10 | 11 |
| 12 | 13 | 14 | 15 | 16 | 17 | 18 |
| 19 | 20 | 21 | 22 | 23 | 24 | 25 |
| 26 | 27 | 28 | 29 | 30 |
Tags
- 월간결산
- MySQL
- 블로그
- Linux
- python visualization
- 통계학
- tensorflow
- Visualization
- 한빛미디어서평단
- 독후감
- Ga
- Python
- Blog
- 텐서플로
- Pandas
- SQL
- 한빛미디어
- matplotlib
- 시각화
- 서평단
- 티스토리
- Tistory
- Google Analytics
- 파이썬
- 딥러닝
- 매틀랩
- MATLAB
- 리눅스
- 서평
- 파이썬 시각화
Archives
- Today
- Total
pbj0812의 코딩 일기
[PYTHON] plotly 를 통해 sankey diagram 그리기 본문
0. 목표
- plotly 를 통해 sankey diagram 그리기
1. 실습
1) library 호출
import plotly.graph_objects as go
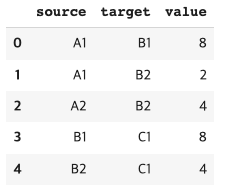
import pandas as pd2) 데이터 생성
df = pd.DataFrame({
    'source' : ['A1', 'A1', 'A2', 'B1', 'B2'],
    'target' : ['B1', 'B2', 'B2', 'C1', 'C1'],
    'value' : [8, 2, 4, 8, 4]
})
3) 라벨용 데이터 생성
label = pd.DataFrame({
    'name' : ['A1', 'A2', 'B1', 'B2', 'C1'],
    'code' : [0, 1, 2, 3, 4]
})
4) 매핑
dict_sido = label.set_index('name')['code'].to_dict()
df['source2'] = df['source'].map(dict_sido)
df['target2'] = df['target'].map(dict_sido)
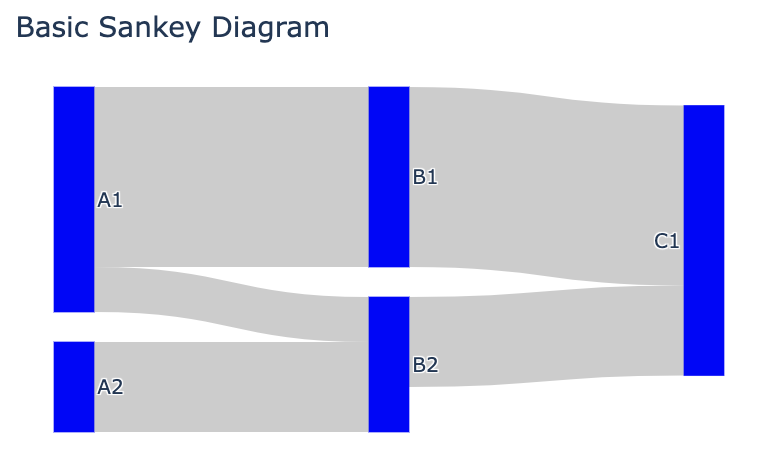
5) 그림
fig = go.Figure(data=[go.Sankey(
    node = dict(
      pad = 30, # 바 사이의 간격
      thickness = 40, # 바의 굵기
      line = dict(color = "blue", width = 0.5), # 선 관리
      label = ["A1", "A2", "B1", "B2", "C1", "C2", "D1", "D2", "D3"],
      color = "blue" # 바 색상
    ),
    link = dict(
      source = df['source2'], # 어디에서, 0 : A1, 2 : A2
      target = df['target2'], # 어디로
      value = df['value'] # 얼만큼 보내는가
  ))])

fig.update_layout(title_text="Basic Sankey Diagram", font_size=20)
fig.show()
2. 결과
3. 참고 문헌
'ComputerLanguage_Program > PYTHON' 카테고리의 다른 글
| [PYTHON] 튜플 언패킹 (0) | 2024.03.20 |
|---|---|
| [PYTHON] plotly 를 이용하여 sankey diagram 그리기(+ 색상 추가) (1) | 2023.10.19 |
| [PYTHON] OpenCV 를 활용한 그래프의 y 좌표 구하기 (0) | 2023.09.13 |
| [PYTHON] PyScript 로 그림 그리기 (0) | 2023.02.06 |
| [PYTHON] 피보나치 수열 시각화 (0) | 2022.11.13 |
'ComputerLanguage_Program/PYTHON' Related Articles
more


Comments