Notice
Recent Posts
Recent Comments
Link
| 일 | 월 | 화 | 수 | 목 | 금 | 토 |
|---|---|---|---|---|---|---|
| 1 | 2 | 3 | ||||
| 4 | 5 | 6 | 7 | 8 | 9 | 10 |
| 11 | 12 | 13 | 14 | 15 | 16 | 17 |
| 18 | 19 | 20 | 21 | 22 | 23 | 24 |
| 25 | 26 | 27 | 28 | 29 | 30 | 31 |
Tags
- python visualization
- 시각화
- SQL
- 독후감
- 파이썬 시각화
- 서평단
- 티스토리
- matplotlib
- 월간결산
- MySQL
- 한빛미디어서평단
- Tistory
- 한빛미디어
- Python
- tensorflow
- 파이썬
- 블로그
- Blog
- 통계학
- Visualization
- Google Analytics
- 딥러닝
- Linux
- 리눅스
- 매틀랩
- 텐서플로
- 서평
- MATLAB
- Pandas
- Ga
Archives
- Today
- Total
pbj0812의 코딩 일기
[PYTHON] PyScript 로 그림 그리기 본문
0. 작업 준비
- 파일 확장자는 html 로 한다.
1. 코드 작성
- link, script 는 복붙하면 된다.
- py-config 에는 불러올 라이브러리를 적는다.
- py-script 에 본문을 적는다.
- 마지막에 쓴 display 함수를 통해 그릴 곳을 지정한다.
- id = graph-area 확인
<html>
  <head>
    <title>plot</title>
    <meta charset="utf-8">
    <link rel="stylesheet" href="https://pyscript.net/latest/pyscript.css" />
    <script defer src="https://pyscript.net/latest/pyscript.js"></script>
  </head>
  <body>

    <py-config>
      packages = ["matplotlib", "numpy"]
    </py-config>

    <py-script>
      import numpy as np
      import matplotlib.pyplot as plt
      from matplotlib.patches import Ellipse, Polygon

      x = -1
      y = abs(x) * np.tan(1/3 * np.pi)
      y_1 = 1/3 * y
      y_2 = 2/3 * y

      data = [1, 1, 2]
      n = 15

      fig, ax = plt.subplots(1, 1, figsize = [10, 10])


      ax.plot([x, 0], [-y_1, y_2], linestyle='solid', linewidth=20, solid_capstyle='round', color='black')
      ax.plot([x, -x], [-y_1, -y_1], linestyle='solid', linewidth=20, solid_capstyle='round', color='black')
      ax.plot([0, -x], [y_2, -y_1], linestyle='solid', linewidth=20, solid_capstyle='round', color='black')


      ax.plot([2/3 * x, -1/3 * x], [0, 1/2 * y_2], linestyle='solid', linewidth=20, solid_capstyle='round', color='black')
      ax.plot([-1/3 * x, -1/3 * x], [y_1, -y_1], linestyle='solid', linewidth=20, solid_capstyle='round', color='black')
      ax.plot([2/3 * x, -1/3 * x], [0, -y_1], linestyle='solid', linewidth=20, solid_capstyle='round', color='black')


      ax.plot([2/3 * x, 0], [0, 0], linestyle='solid', linewidth=20, solid_capstyle='round', color='black')
      ax.plot([0, -1/3 * x], [0, 1/2 * y_2], linestyle='solid', linewidth=20, solid_capstyle='round', color='black')
      ax.plot([0, -1/3 * x], [0, -1/2 * y_2], linestyle='solid', linewidth=20, solid_capstyle='round', color='black')


      ax.add_patch(Polygon([(2/3 * x, 0), (0, 0), (-1/3 * x, 1/2 * y_2)], facecolor = '#B8E5FA'))
      ax.add_patch(Polygon([(2/3 * x, 0), (0, 0), (-1/3 * x, -1/2 * y_2)], facecolor = '#1D67B0'))
      ax.add_patch(Polygon([(-1/3 * x, 1/2 * y_2), (0, 0), (-1/3 * x, -1/2 * y_2)], facecolor = '#37BDF3'))

      ax.axis('off')
      ax.axis('square')
      display(fig, target="graph-area", append=False)
    </py-script>

    <div id="graph-area"></div>
  </body>
</html>
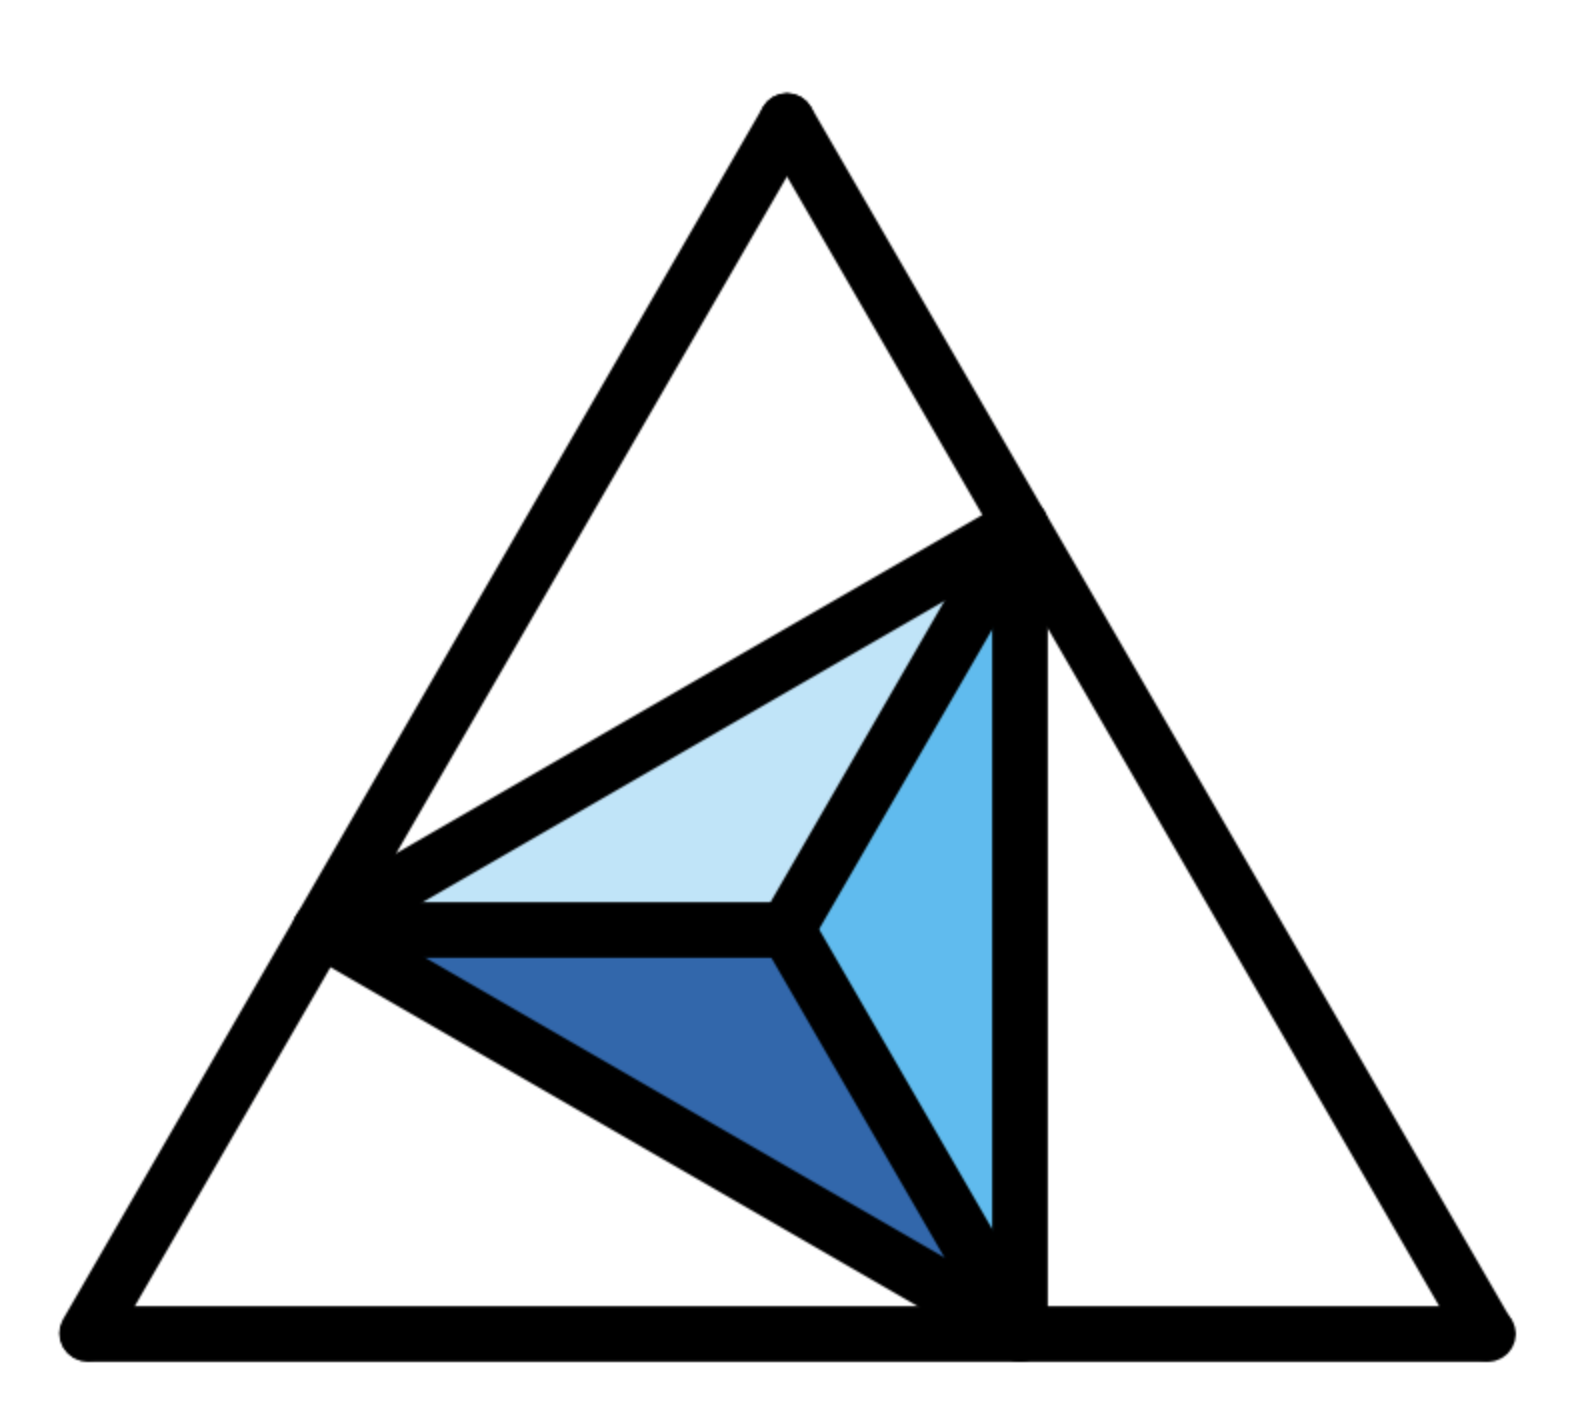
2. 결과
- 작성한 html 파일을 실행한다.

3. 기타
- 실행할 때 이런 로딩화면이 도는데... 이쁘진 않다.

4. 참고
Getting started with PyScript — PyScript documentation
Getting started with PyScript This page will guide you through getting started with PyScript. Development setup PyScript does not require any development environment other then a web browser (we recommend using Chrome) and a text editor, even though using
docs.pyscript.net
'ComputerLanguage_Program > PYTHON' 카테고리의 다른 글
| [PYTHON] plotly 를 통해 sankey diagram 그리기 (0) | 2023.10.18 |
|---|---|
| [PYTHON] OpenCV 를 활용한 그래프의 y 좌표 구하기 (0) | 2023.09.13 |
| [PYTHON] 피보나치 수열 시각화 (0) | 2022.11.13 |
| [PYTHON] 기하학 로고 그리기 (1) | 2022.11.06 |
| [PYTHON] matplotlib 으로 원기옥(음식점 이름) 로고 그리기 (0) | 2022.10.26 |
Comments


