
Notice
Recent Posts
Recent Comments
Link
| 일 | 월 | 화 | 수 | 목 | 금 | 토 |
|---|---|---|---|---|---|---|
| 1 | 2 | 3 | 4 | 5 | 6 | 7 |
| 8 | 9 | 10 | 11 | 12 | 13 | 14 |
| 15 | 16 | 17 | 18 | 19 | 20 | 21 |
| 22 | 23 | 24 | 25 | 26 | 27 | 28 |
| 29 | 30 |
Tags
- Google Analytics
- 딥러닝
- 리눅스
- 블로그
- 매틀랩
- 월간결산
- Pandas
- MySQL
- Python
- 서평단
- 한빛미디어
- matplotlib
- Ga
- 독후감
- SQL
- 서평
- 통계학
- 한빛미디어서평단
- Visualization
- 텐서플로
- 파이썬 시각화
- Tistory
- tensorflow
- 파이썬
- python visualization
- Blog
- 티스토리
- Linux
- 시각화
- MATLAB
Archives
- Today
- Total
pbj0812의 코딩 일기
[통계학] PYTHON을 이용한 RMSE, MAPE 구현 및 데이터에 따른 결과 비교 본문
0. 목표
- PYTHON을 이용한 RMSE, MAPE 구현 및 데이터에 따른 결과 비교
1. 실습
1) library 호출
import matplotlib.pyplot as plt2) 제곱근 함수
def sqrt(inp):
    result = inp/2
    for i in range(30):
        result = (result + (inp / result)) / 2
    return result
3) RMSE
# inp1 : real
# inp2 : esti
def rmse(inp1, inp2):
    result = 0
    for i in range(len(inp1)):
        result += (inp1[i] - inp2[i]) ** 2
    result = sqrt(result / len(inp1))
    return result
4) MAPE
# inp1 : real
# inp2 : esti
def mape(inp1, inp2):
    result = 0
    for i in range(len(inp1)):
        result += abs((inp1[i] - inp2[i]) / inp1[i])
    result = result * 100 / len(inp1)
    return result
5) 테스트
(1) 실제값과 예측값이 비슷한 경우
- RMSE : 0.09486832980505117
- MAPE : 2.614273196525935
real = [1.1, 2.1, 2.9, 4.1, 5, 6.1, 7.1, 7.9, 9.1, 10.1]
esti = [1, 2, 3, 4, 5, 6, 7, 8, 9, 10]

plt.plot(real)
plt.plot(esti)

print('RMSE : ', rmse(real, esti))
print('MAPE : ', mape(real, esti))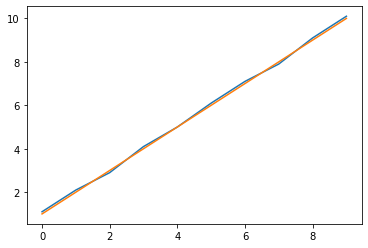
(2) 실제값에 이상치가 존재하는 경우
- RMSE : 30.041787563325858
- MAPE : 12.114273196525936
real = [1.1, 2.1, 2.9, 4.1, 100, 6.1, 7.1, 7.9, 9.1, 10.1]
esti = [1, 2, 3, 4, 5, 6, 7, 8, 9, 10]

plt.plot(real)
plt.plot(esti)

print('RMSE : ', rmse(real, esti))
print('MAPE : ', mape(real, esti))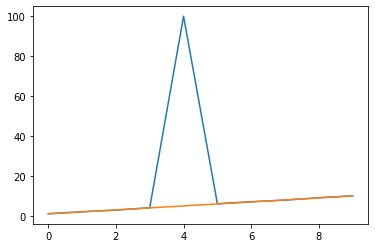
(3) 이상치가 더 큰 경우
- RMSE : 314.6466414885117
- MAPE : 12.564273196525937
real = [1.1, 2.1, 2.9, 4.1, 1000, 6.1, 7.1, 7.9, 9.1, 10.1]
esti = [1, 2, 3, 4, 5, 6, 7, 8, 9, 10]

plt.plot(real)
plt.plot(esti)

print('RMSE : ', rmse(real, esti))
print('MAPE : ', mape(real, esti))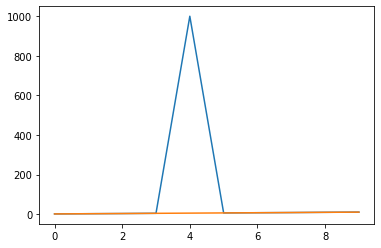
2. 결론
- 데이터를 까봐야 함.
3. 참고
'Science > 통계학' 카테고리의 다른 글
| [통계학] PYTHON 을 이용한 AUC 계산 (0) | 2020.11.10 |
|---|---|
| [통계학] ROC 곡선 그리기 (0) | 2020.11.09 |
| [통계학] python을 이용한 최소제곱법과 경사하강법 구현 (0) | 2020.10.04 |
| [통계학] python을 통한 제곱합(SS), 제곱평균(MS), 처리간 제곱합(SSB), 처리내 제곱합(SSE), 총제곱합(SST) (0) | 2020.10.03 |
| [통계학] python을 통한 체계적 표본추출 구현 (0) | 2020.09.18 |
'Science/통계학' Related Articles
more


Comments