
Notice
Recent Posts
Recent Comments
Link
| 일 | 월 | 화 | 수 | 목 | 금 | 토 |
|---|---|---|---|---|---|---|
| 1 | 2 | 3 | 4 | 5 | ||
| 6 | 7 | 8 | 9 | 10 | 11 | 12 |
| 13 | 14 | 15 | 16 | 17 | 18 | 19 |
| 20 | 21 | 22 | 23 | 24 | 25 | 26 |
| 27 | 28 | 29 | 30 |
Tags
- 블로그
- 월간결산
- SQL
- Python
- Tistory
- 통계학
- Blog
- Google Analytics
- 시각화
- 딥러닝
- 서평
- 파이썬 시각화
- Pandas
- MATLAB
- 매틀랩
- 한빛미디어
- python visualization
- tensorflow
- Visualization
- 리눅스
- matplotlib
- 독후감
- MySQL
- 서평단
- Linux
- 텐서플로
- Ga
- 한빛미디어서평단
- 파이썬
- 티스토리
Archives
- Today
- Total
목록matplotlib ylabel (1)
pbj0812의 코딩 일기
 [PYTHON] matplotlib 으로 FacetGrid 함수 구현하기
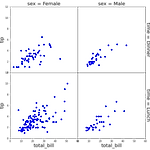
0. 목표 - matplotlib 으로 FacetGrid 구현하기 1. FacetGrid 예제 import seaborn as sns tips = sns.load_dataset("tips") g = sns.FacetGrid(tips, col="sex", row="time", margin_titles=True, despine=False) g.map_dataframe(sns.scatterplot, x="total_bill", y="tip") g.set_axis_labels("Total bill", "Tip") g.fig.subplots_adjust(wspace=0, hspace=0) 2. 실습 1) library 호출 import matplotlib.pyplot as plt 2) 함수 작성 (1) 도화지 분..
ComputerLanguage_Program/PYTHON
2021. 8. 2. 02:20