
| 일 | 월 | 화 | 수 | 목 | 금 | 토 |
|---|---|---|---|---|---|---|
| 1 | 2 | 3 | ||||
| 4 | 5 | 6 | 7 | 8 | 9 | 10 |
| 11 | 12 | 13 | 14 | 15 | 16 | 17 |
| 18 | 19 | 20 | 21 | 22 | 23 | 24 |
| 25 | 26 | 27 | 28 | 29 | 30 | 31 |
- 리눅스
- Visualization
- 한빛미디어서평단
- MySQL
- SQL
- 독후감
- 블로그
- 매틀랩
- 파이썬
- 월간결산
- 서평단
- 딥러닝
- Pandas
- 한빛미디어
- MATLAB
- python visualization
- Tistory
- 티스토리
- 통계학
- Blog
- matplotlib
- 서평
- Linux
- Python
- 시각화
- Ga
- 텐서플로
- tensorflow
- 파이썬 시각화
- Google Analytics
- Today
- Total
목록EDA (4)
pbj0812의 코딩 일기
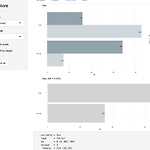 [R] explore 라이브러리를 통한 EDA
0. 목표 - explore 라이브러리를 통한 EDA 1. 실습 1) 설치 install.packages("explore") 2) library 호출 library(explore) 3) csv 읽기 - 캐글의 타이타닉 데이터 df
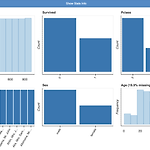 [PYTHON] dataprep을 통한 EDA
0. 목표 - dataprep 을 통한 EDA 1. 설치 pip install dataprep 2. 실습 1) library 호출 from dataprep.eda import * import pandas as pd 2) 데이터 읽기 - titanic 데이터 사용 train_df = pd.read_csv('/Users/pbj0812/Desktop/titanic/train.csv') 3) 전체 데이터에 대한 plot plot(train_df) - 위의 Show Stats Info 클릭시 요약 테이블 정보 호출 4) 데이터 카테고리화 및 재 시각화 - Survived와 Pclass는 숫자가 아닌 카테고리이기 때문에 object로 변환 for col in ['Survived', 'Pclass']: train_d..
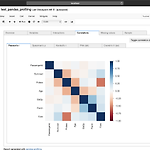 [PYTHON] pandas_profiling을 통한 EDA
0. 목표 - pandas_profiling을 통한 jupyter notebook 에서의 EDA 1. 설치 pip install pandas-profiling 2. 실습 1) library 호출 import numpy as np import pandas as pd from pandas_profiling import ProfileReport 2) 데이터 호출 - 타이타닉 데이터 사용 df = pd.read_csv("/Users/pbj0812/Desktop/titanic/train.csv") 3) 보고서 생성 profile = ProfileReport(df, title='Pandas Profiling Report', explorative=True) 4) 보여주기 profile.to_widgets() - 결과..
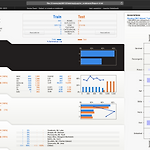 [PYTHON] sweetviz를 통한 EDA
0. 목표 - sweetviz 를 통한 EDA 1. 실습 1) 설치 pip install sweetviz 2) library 호출 import sweetviz import pandas as pd 3) 데이터 불러오기 - 데이터는 타이타닉 데이터 사용 train = pd.read_csv("/Users/pbj0812/Desktop/titanic/train.csv") test = pd.read_csv("/Users/pbj0812/Desktop/titanic/test.csv") 4) 리포트 생성 my_report = sweetviz.compare([train, "Train"], [test, "Test"], "Survived") 5) 리포트 표출 - html 형식으로 표출 my_report.show_html("R..