Notice
Recent Posts
Recent Comments
Link
| 일 | 월 | 화 | 수 | 목 | 금 | 토 |
|---|---|---|---|---|---|---|
| 1 | 2 | 3 | ||||
| 4 | 5 | 6 | 7 | 8 | 9 | 10 |
| 11 | 12 | 13 | 14 | 15 | 16 | 17 |
| 18 | 19 | 20 | 21 | 22 | 23 | 24 |
| 25 | 26 | 27 | 28 | 29 | 30 | 31 |
Tags
- Visualization
- Blog
- 블로그
- 티스토리
- python visualization
- 시각화
- 월간결산
- 매틀랩
- 딥러닝
- 통계학
- SQL
- Google Analytics
- Python
- matplotlib
- 독후감
- MATLAB
- 파이썬 시각화
- Tistory
- 텐서플로
- 한빛미디어
- tensorflow
- Linux
- 서평단
- 파이썬
- 리눅스
- MySQL
- 한빛미디어서평단
- Pandas
- Ga
- 서평
Archives
- Today
- Total
pbj0812의 코딩 일기
[PYTHON] 음영이 포함된 라인차트 그리기 본문
0. 목표
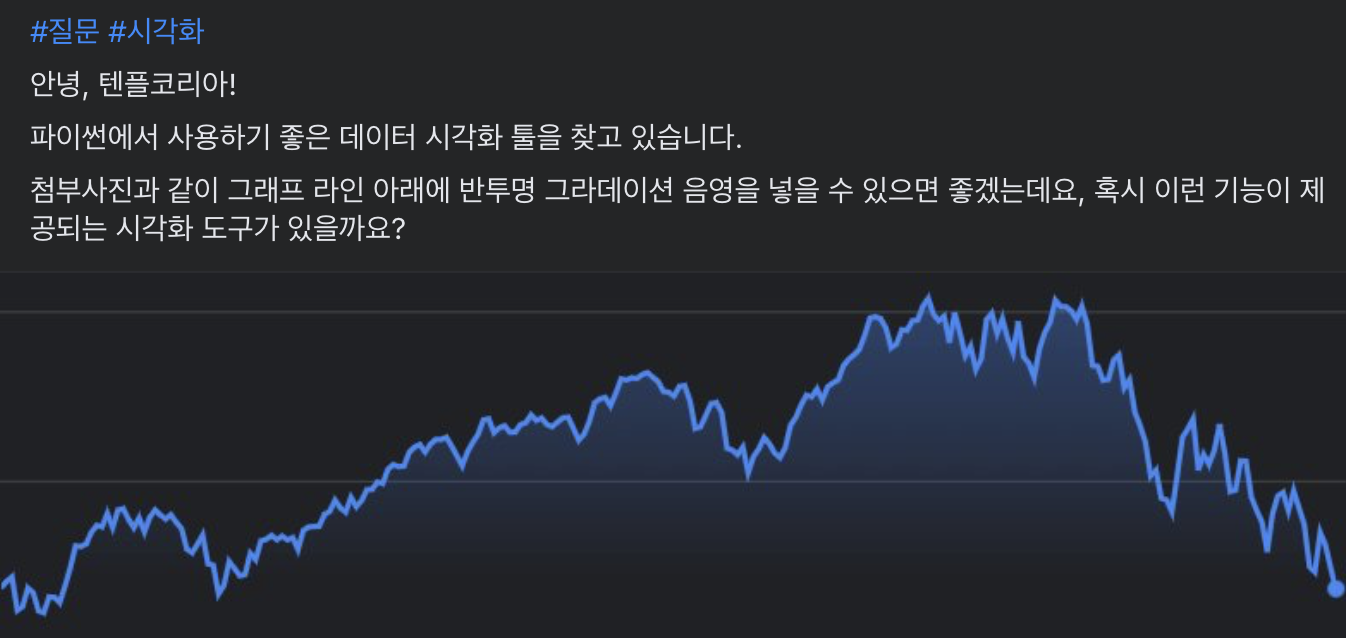
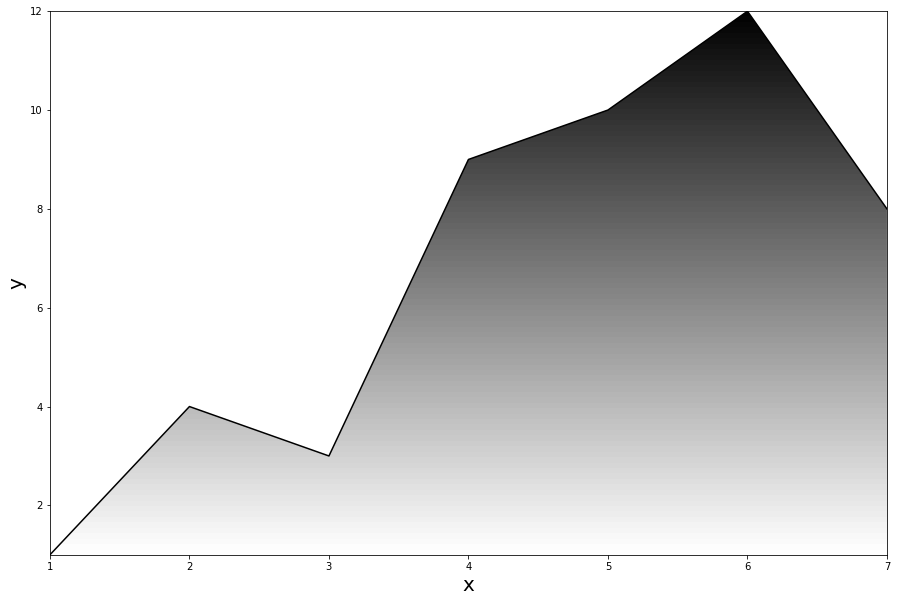
- 음영이 포함된 라인차트 그리기

1. 실습
1) library 호출
import numpy as np
import matplotlib.pyplot as plt
import matplotlib.colors as mcolors
from matplotlib.patches import Polygon
2) 함수 생성
- 인자로 x, y, 라인(+ 음영) 색상 삽입
def area_gradation(x, y, color = 'b'):
    x = np.array(x)
    y = np.array(y)
    fig, ax = plt.subplots()
    line, = ax.plot(x, y, color)
    fill_color = line.get_color() # 선 색상 얻기(HEX 형식)
    zorder = line.get_zorder() # zorder(layer 위치) 값
    alpha = 1
    z = np.empty((100, 1, 4), dtype = float) # rgb + alpha
    rgb = mcolors.colorConverter.to_rgb(fill_color) # HEX 형식에서 rgb 로 변경
    z[:,:,:3] = rgb # z 의 앞 3 칸에 입력
    z[:,:,-1] = np.linspace(0, alpha, 100)[:,None] # alpha 값 작성 0 ~ 1 까지 100 등분하고 형태 변환한 값을 z 의 마지막 칸에 입력
    xmin, xmax, ymin, ymax = x.min(), x.max(), y.min(), y.max() # x, y array 에서 최소 최대값 획득
    im = ax.imshow(z, aspect='auto', extent=[xmin, xmax, ymin, ymax], # extent 로 축 범위 설정
                       origin='lower', zorder=zorder) # origin 으로 gradation 방향 설정
    # gradation 을 전체 범위에서 해당 폴리곤 범위에 적용
    xy = np.column_stack([x, y]) # x + y 로 2차원 행렬 생성
    xy = np.vstack([[xmin, ymin], xy, [xmax, ymin], [xmin, ymin]])
    clip_path = Polygon(xy, facecolor='none', edgecolor='none', closed=True)
    ax.add_patch(clip_path)
    im.set_clip_path(clip_path)
    ax.autoscale(True)
    return im, fig, ax
3) 그림 그리기
im, fig, ax = area_gradation([1, 2, 3, 4, 5, 6, 7], [1, 4, 3, 9, 10, 12, 8], 'k')
# 축
ax.set_xlabel('x', fontsize = 20)
ax.set_ylabel('y', fontsize = 20)
# 그림 크기
fig.set_size_inches(15, 10)
2. 결과

3. 참고
1) Is it possible to get color gradients under curve in matplotlib?
3) [파이썬 matplotlib] 이미지맵(imshow) 범위설정하기
4) origin and extent in imshow
'ComputerLanguage_Program > PYTHON' 카테고리의 다른 글
| [PYTHON] 로그 스케일로 그림 그리기 (0) | 2022.07.23 |
|---|---|
| [PYTHON] venn2_circles 로 달 그리기 (0) | 2022.07.22 |
| [python] 연령 별 연봉 그래프 그리기 (0) | 2022.02.24 |
| [PYTHON] 동일한 알파벳에 동일한 색을 매핑하여 파이차트 그리기 (0) | 2022.01.07 |
| [PYTHON] 특정 그룹에 해당하는 bar 들만 색칠하기 (0) | 2022.01.05 |
Comments


