
Notice
Recent Posts
Recent Comments
Link
| 일 | 월 | 화 | 수 | 목 | 금 | 토 |
|---|---|---|---|---|---|---|
| 1 | 2 | 3 | ||||
| 4 | 5 | 6 | 7 | 8 | 9 | 10 |
| 11 | 12 | 13 | 14 | 15 | 16 | 17 |
| 18 | 19 | 20 | 21 | 22 | 23 | 24 |
| 25 | 26 | 27 | 28 | 29 | 30 | 31 |
Tags
- 독후감
- Python
- 한빛미디어
- 텐서플로
- Blog
- 월간결산
- 딥러닝
- 파이썬 시각화
- matplotlib
- Google Analytics
- Linux
- Pandas
- 블로그
- MATLAB
- tensorflow
- 통계학
- 서평단
- Ga
- 시각화
- 한빛미디어서평단
- Visualization
- 파이썬
- MySQL
- SQL
- 서평
- 리눅스
- Tistory
- 티스토리
- 매틀랩
- python visualization
Archives
- Today
- Total
pbj0812의 코딩 일기
[PYTHON] 육각 방사형 차트 구현 본문
0. 목표
- 육각형 모양의 방사형 차트 구현

1. 플로우 차트
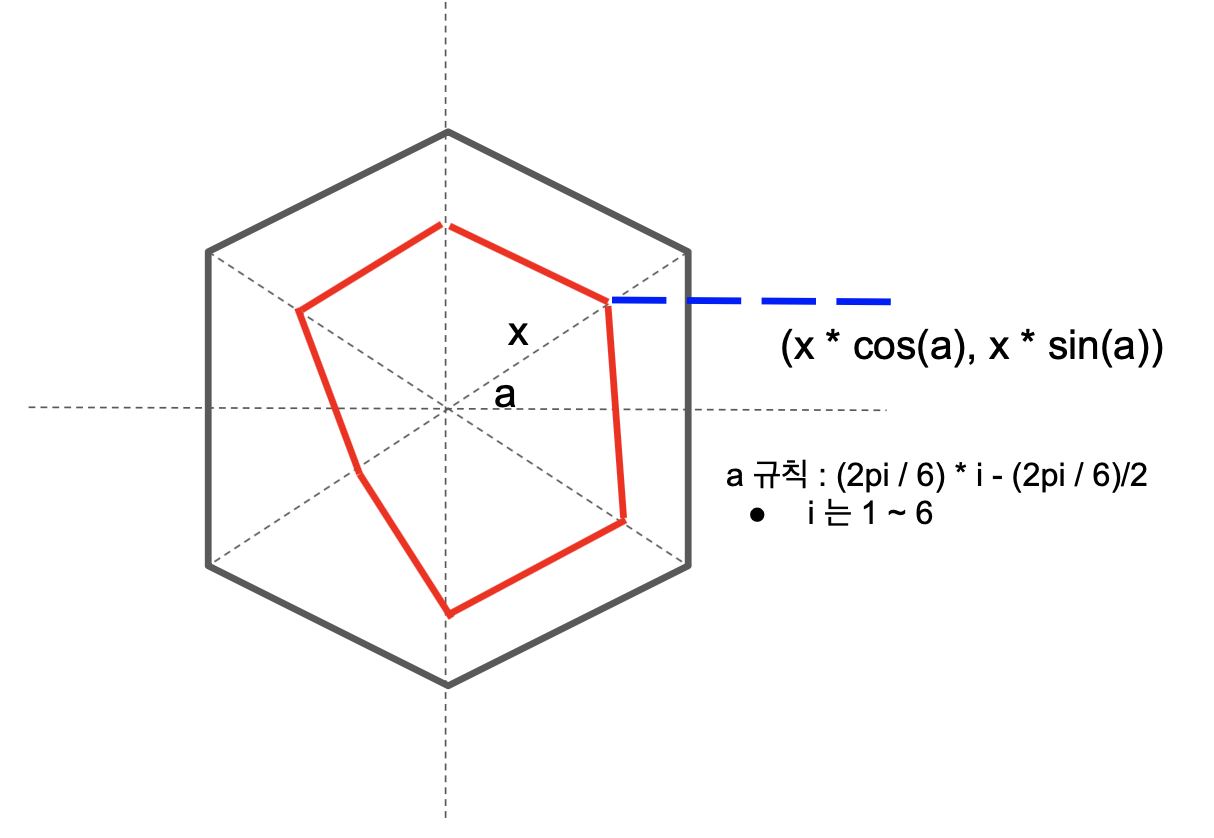
- cos, sin으로 각 좌표의 x, y 좌표 계산
- 육각형을 세우기 위하여 30도씩 빼줌
2. 구현
1) library 호출
import matplotlib.pyplot as plt
import numpy as np
2) 제곱근
def sqrt(inp):
    result = inp/2
    for i in range(30):
        result = (result + (inp / result)) / 2
    return result
3) 좌표 계산
- 마지막에는 처음의 좌표를 한번 더 넣어 그림을 그릴때 끝 부분을 이어지게 만들어줌
def honeycomb_list(inp):
    result_x = []
    result_y = []
    for i in range(6):
        theta = (2 * np.pi / 6) * (i + 1) - (2 * np.pi / 6) / 2
        result_x.append(inp[i] * np.cos(theta))
        result_y.append(inp[i] * np.sin(theta))
    theta = (2 * np.pi / 6) * (0 + 1) - (2 * np.pi / 6) / 2
    result_x.append(inp[0] * np.cos(theta))
    result_y.append(inp[0] * np.sin(theta))
    return result_x, result_y
4) 그래프
- 인풋값으로 점수의 최고값과 점수 리스트를 받음
- 각 리스트에 +1 씩 더한 더미 리스트를 만들어 점수 및 문자를 쓰도록 구현
# inp1 : 최고점
# inp2 : 점수 리스트
def honeycomb_graph(inp1, inp2):
    max_list = np.zeros(6) + inp1
    max_x, max_y = honeycomb_list(max_list)
    x, y = honeycomb_list(inp2)
    fig, ax = plt.subplots()
    fig.set_size_inches(15, 15)
    fig.patch.set_visible(False)
    ax.axis('off')
    # 바깥쪽 그래프
    plt.plot(max_x, max_y, 'b')
    # 안쪽 그래프
    plt.plot(x, y, 'r')
    # 색 채우기
    plt.fill_between(x, y, 0, facecolor="red", alpha=0.2)
    # 점수쓰기
    score_list = np.array(inp2) + 1
    score_x, score_y = honeycomb_list(score_list)
    # 글자쓰기
    text = ['a', 'b', 'c', 'd', 'e', 'f']
    text_x, text_y = honeycomb_list(max_list + 1)
    for i in range(6):
        # 점수
        plt.text(score_x[i], score_y[i], inp2[i], fontsize = 18)
        # 점선
        plt.plot([0, max_x[i]], [0, max_y[i]], linestyle = '--', color = 'gray')
        # 글자
        plt.text(text_x[i], text_y[i], text[i], fontsize = 24)
2. 테스트
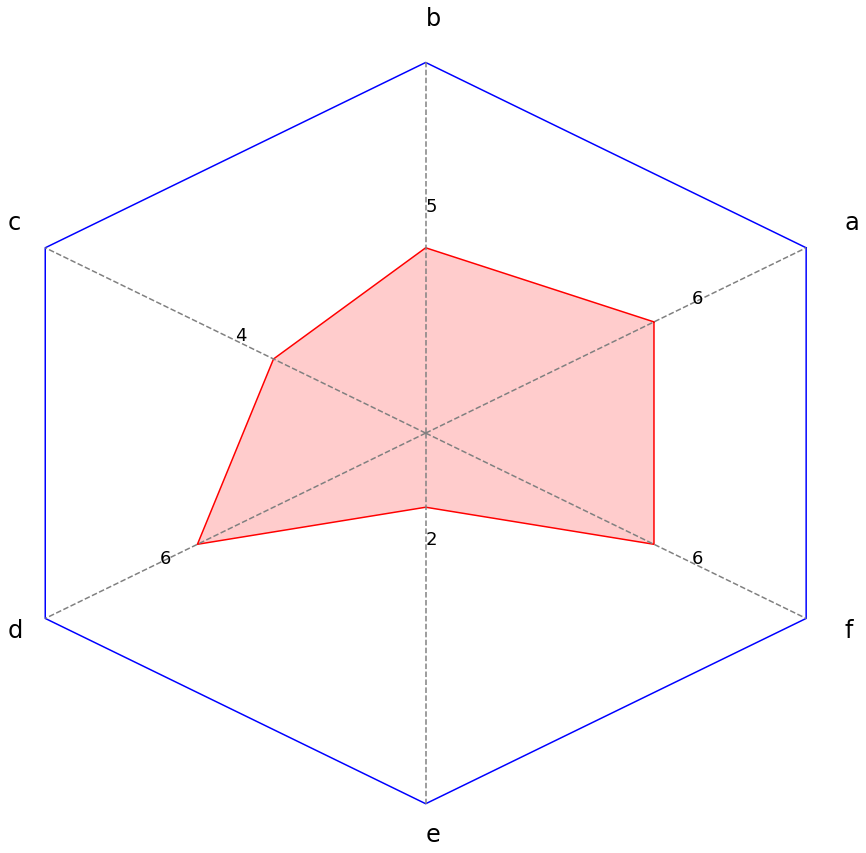
data = [6, 5, 4, 6, 2, 6]
honeycomb_graph(10, data)
- 결과
3. 참고
'ComputerLanguage_Program > PYTHON' 카테고리의 다른 글
| [PYTHON] arrow 라이브러리 소개(시간/날짜) (0) | 2020.12.06 |
|---|---|
| [PYTHON] 남은 업무시간 계산하기 (0) | 2020.11.22 |
| [PYTHON] PyQt를 활용한 반복 수행 앱 제작 (0) | 2020.10.27 |
| [PYTHON] PIL 을 이용한 이미지 생성시간 추출 (0) | 2020.10.18 |
| [PYTHON] OpenCV 를 활용한 타임스탬프 어플 클론 코딩 (0) | 2020.10.17 |
'ComputerLanguage_Program/PYTHON' Related Articles
more


Comments