Notice
Recent Posts
Recent Comments
Link
| 일 | 월 | 화 | 수 | 목 | 금 | 토 |
|---|---|---|---|---|---|---|
| 1 | 2 | 3 | 4 | 5 | 6 | 7 |
| 8 | 9 | 10 | 11 | 12 | 13 | 14 |
| 15 | 16 | 17 | 18 | 19 | 20 | 21 |
| 22 | 23 | 24 | 25 | 26 | 27 | 28 |
Tags
- 리눅스
- tensorflow
- Visualization
- 월간결산
- python visualization
- 티스토리
- Tistory
- SQL
- Ga
- Blog
- matplotlib
- 서평단
- 독후감
- 한빛미디어서평단
- Google Analytics
- MATLAB
- 시각화
- 텐서플로
- MySQL
- 한빛미디어
- Linux
- Pandas
- Python
- 블로그
- 파이썬
- 매틀랩
- 서평
- 딥러닝
- 파이썬 시각화
- 통계학
Archives
- Today
- Total
pbj0812의 코딩 일기
[PYTHON] python으로 3차원 그림 그리기 본문
0. 목표
- python으로 3차원 그림 그리기
1. 데이터 준비
1) library 호출
import numpy as np
import matplotlib.pyplot as plt
from matplotlib import cm
2) 데이터 생성
- x, y : 0 ~ 100 을 101 등분
x = np.linspace(0, 100, 101)
y = np.linspace(0, 100, 101)
3) meshgrid 형태 제작
X, Y = np.meshgrid(x, y)4) X, Y 확인
print(X)
print(Y)
- 결과
[[  0.   1.   2. ...  98.  99. 100.]
 [  0.   1.   2. ...  98.  99. 100.]
 [  0.   1.   2. ...  98.  99. 100.]
 ...
 [  0.   1.   2. ...  98.  99. 100.]
 [  0.   1.   2. ...  98.  99. 100.]
 [  0.   1.   2. ...  98.  99. 100.]]

 [[  0.   0.   0. ...   0.   0.   0.]
 [  1.   1.   1. ...   1.   1.   1.]
 [  2.   2.   2. ...   2.   2.   2.]
 ...
 [ 98.  98.  98. ...  98.  98.  98.]
 [ 99.  99.  99. ...  99.  99.  99.]
 [100. 100. 100. ... 100. 100. 100.]]
5) X, Y 시각화
- X와 Y로 이루어진 격자 확인
fig = plt.figure()
fig.set_size_inches(15, 15)
plt.scatter(X, Y)
6) Z 방정식 생성
- z = x + y
- z의 크기는 해당 격자의 x 좌표와 y 좌표의 합 => 최소 0 ~ 최대 200
def Z_fun(x, y):
    result = x + y
    return result
7) Z 생성
Z = Z_fun(X, Y)- Z
array([[  0.,   1.,   2., ...,  98.,  99., 100.],
       [  1.,   2.,   3., ...,  99., 100., 101.],
       [  2.,   3.,   4., ..., 100., 101., 102.],
       ...,
       [ 98.,  99., 100., ..., 196., 197., 198.],
       [ 99., 100., 101., ..., 197., 198., 199.],
       [100., 101., 102., ..., 198., 199., 200.]])
2. 3D 시각화
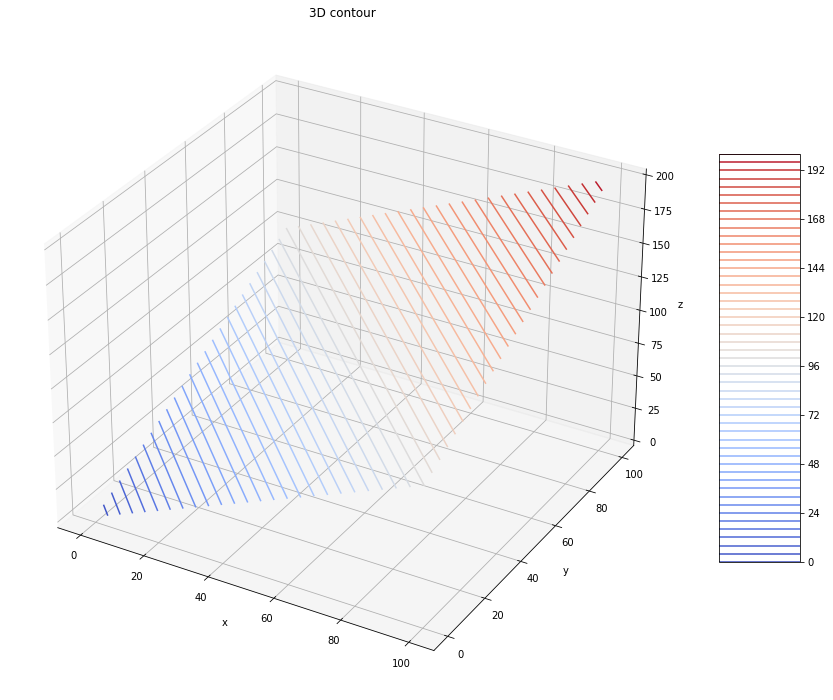
1) contour를 통한 등고선 그림
fig = plt.figure()
fig.set_size_inches(15, 15)
ax = plt.axes(projection='3d')
surf = ax.contour3D(X, Y, Z, 50, cmap=cm.coolwarm)
fig.colorbar(surf, shrink=0.5, aspect=5)
ax.set_xlabel('x')
ax.set_ylabel('y')
ax.set_zlabel('z')
ax.set_title('3D contour')
plt.show()
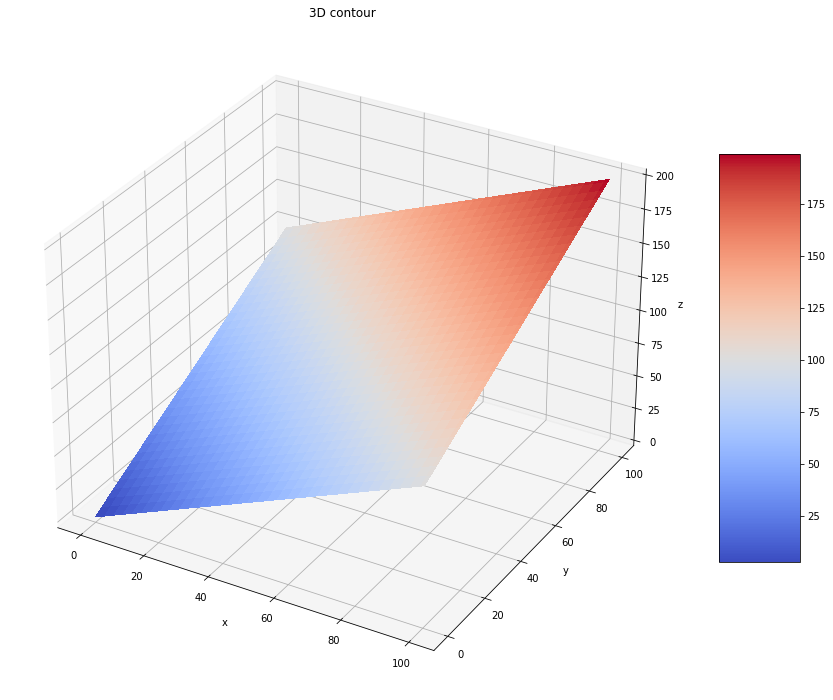
2) plot_surface를 통한 그림
fig, ax = plt.subplots(subplot_kw={"projection": "3d"})
fig.set_size_inches(15, 15)
surf = ax.plot_surface(X, Y, Z, cmap=cm.coolwarm,
                       linewidth=0, antialiased=False)
fig.colorbar(surf, shrink=0.5, aspect=5)
ax.set_xlabel('x')
ax.set_ylabel('y')
ax.set_zlabel('z')
ax.set_title('3D contour')
plt.show()
3) angle 변경
- view_init 추가
fig, ax = plt.subplots(subplot_kw={"projection": "3d"})
fig.set_size_inches(15, 15)
surf = ax.plot_surface(X, Y, Z, cmap=cm.coolwarm,
                       linewidth=0, antialiased=False)
fig.colorbar(surf, shrink=0.5, aspect=5)
ax.set_xlabel('x')
ax.set_ylabel('y')
ax.set_zlabel('z')
ax.set_title('3D contour')
ax.view_init(90, 90)
plt.show()
3. 참고
- Choosing Colormaps in Matplotlib
'ComputerLanguage_Program > PYTHON' 카테고리의 다른 글
| [PYTHON] celluloid 를 활용한 gif 애니메이션 제작 (2) | 2020.10.12 |
|---|---|
| [PYTHON] 파동의 개수 구하기 (0) | 2020.10.07 |
| [PYTHON] PyQt를 활용한 radio button + push button 어플 (0) | 2020.09.24 |
| [PYTHON] plotly를 이용한 dengrogram 그리기 (0) | 2020.09.06 |
| [PYTHON] dataprep을 통한 EDA (0) | 2020.08.23 |
Comments


