ComputerLanguage_Program/PYTHON
[PYTHON] matplotlib 의 barh 로 분수 표현하기
pbj0812
2021. 7. 28. 01:35
0. 목표
- matplotlib 의 barh 로 분수 표현하기
1. 실습하기
1) library 호출
import matplotlib.pyplot as plt2) 함수 제작
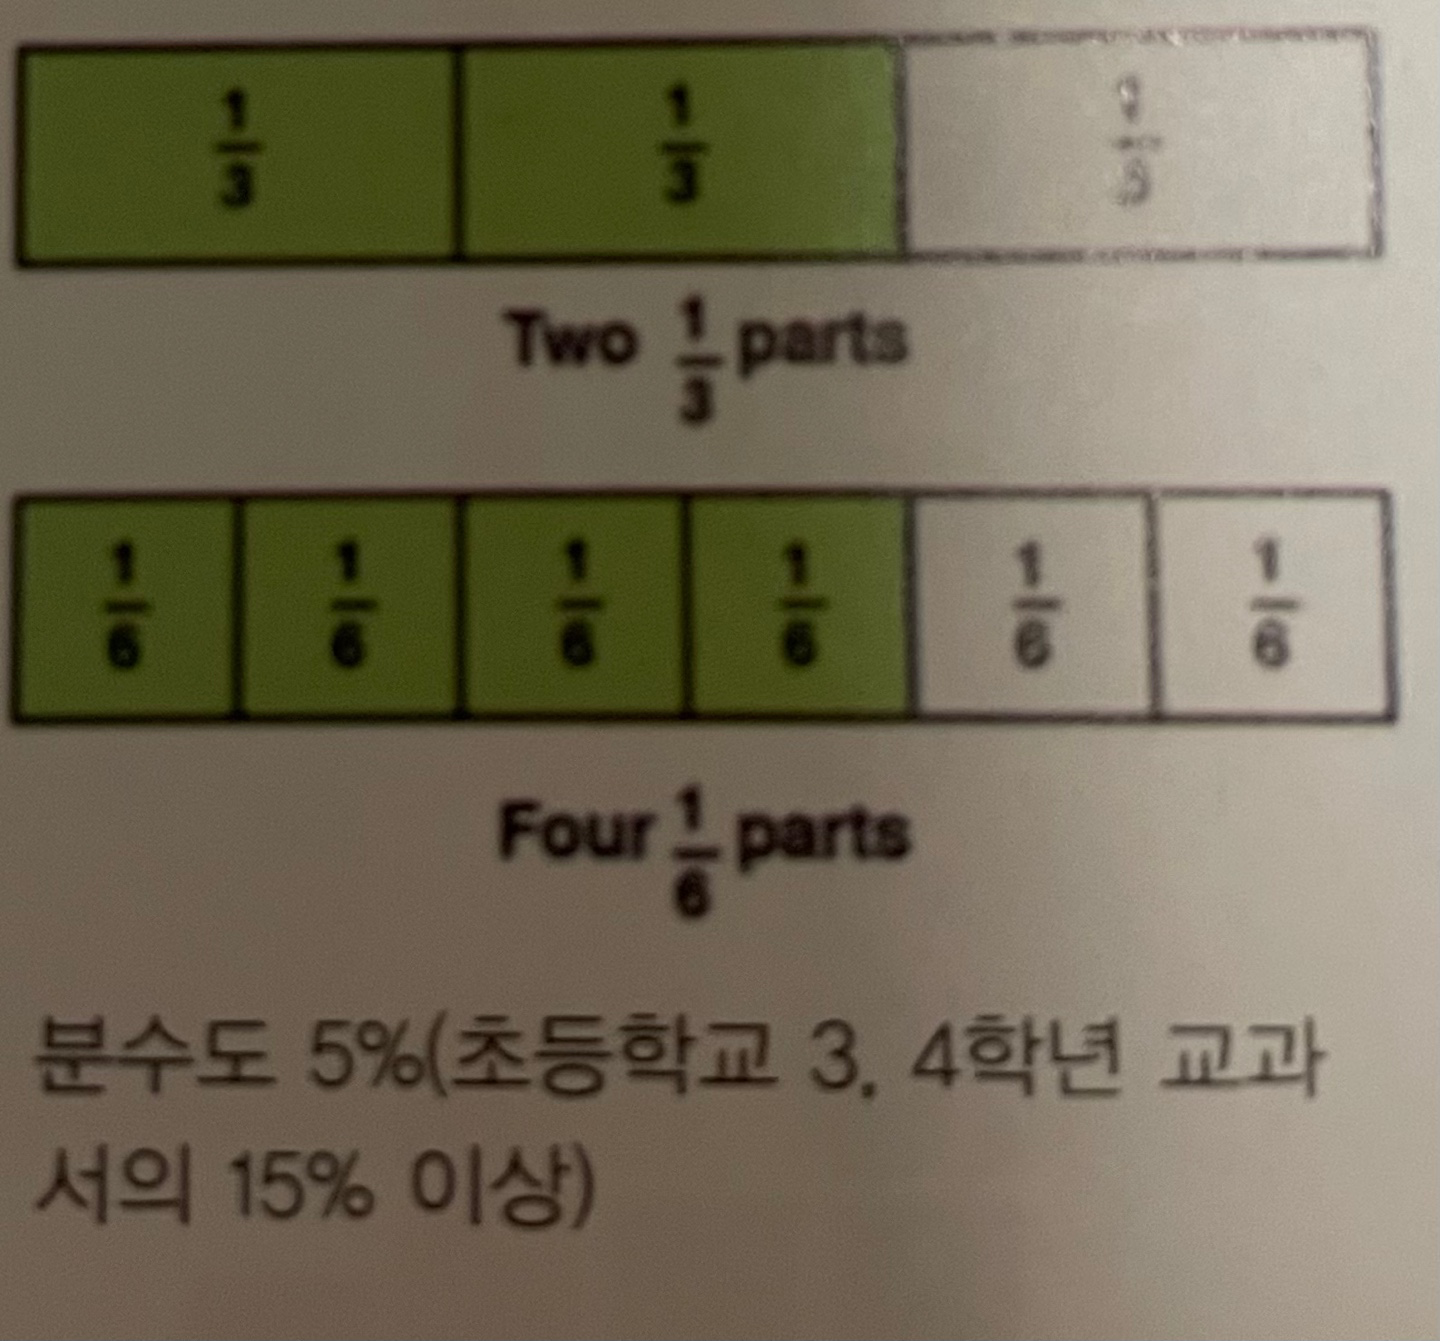
* 분자와 분모에는 정수 형태(분모 : 자연수, 분자 : 정수)만 삽입 가능
(1) a 에는 각 파트별 크기(1 / n), b 에는 분자의 절대값, c 에는 b 를 제외한 나머지의. 값
(2) 피규어 생성
(3) 분자가 0 이 아니면 반복문을 돌면서 b 의 크기만큼 빨간 바를 누적하여 그리고 이후 c 의 크기만큼 하얀색 바를 누적해서 그림
(4) 분자가 0 이면 c 의 크기만큼 하얀색 바를 누적해서 그림
(5) 분자가 0 보다 작은 경우와 아닌 경우를 나눠서 각 바마다 text 로 표시
(6) xlabel 표시
def fraction(numerator, denominator):
# 1
a = 1 /denominator
b = abs(numerator)
c = denominator - abs(numerator)
# 2
fig, ax = plt.subplots()
fig.set_size_inches(15, 2)
ax.set_ylim(0.6, 1.4)
ax.set_xlim(0, 1)
#ax.axis('off')
ax.set_xticks([])
ax.set_yticks([])
# 3
if b != 0:
ax.barh(1, a, linewidth = 2, color= 'r', edgecolor = 'k')
for i in range(b):
ax.barh(1, a, linewidth = 2, left = a * i, color= 'r', edgecolor = 'k')
for j in range(c):
ax.barh(1, a, linewidth = 2, left = a * (i + 1) + a * j, color= 'w', edgecolor = 'k')
# 4
else:
for i in range(c):
ax.barh(1, a, linewidth = 2, left = a * i, color= 'w', edgecolor = 'k')
# 5
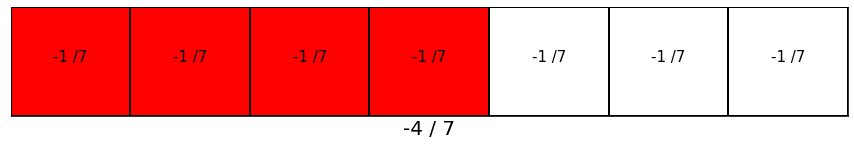
if numerator < 0:
aa = '-1 /'
else:
aa = '1 /'
for k in range(denominator):
ax.text(k * a + a / 2, 1, aa + str(denominator), fontsize = 15, horizontalalignment = 'center')
# 6
ax.set_xlabel(str(numerator) + ' / ' + str(denominator), fontsize = 20)2. 결과
1) fraction(4,9)

2) fraction(1, 3)

3) fraction(0, 8)

4) fraction(-4, 7)
3. 참고
- [python] matplotlib 플롯에서 xticks를 제거 하시겠습니까?
- 파이썬(python) 시각화 Matplotlib 기초 (2)